We are now half way through the season, and the Wolverines are 5-1. I am going to look at the performance versus Maryland alongside some trends and averages to this point. My goal is to provide a useful prism through which we can view these critical upcoming games versus Wisconsin, Michigan State, and Penn State.
What is S&P+
The original system was based on Success rate and equivalent Points per play. It was an attempt at an OPS-style measure for football, a look at both efficiency and explosiveness. As so many things do, however, it has grown more complicated.In its current state, S&P+ is based around the core concepts of the Five Factors of winning football: efficiency, explosiveness, field position, finishing drives, and turnovers. Full Explanation |
TABLE: FIVE FACTORS

OFFENSE
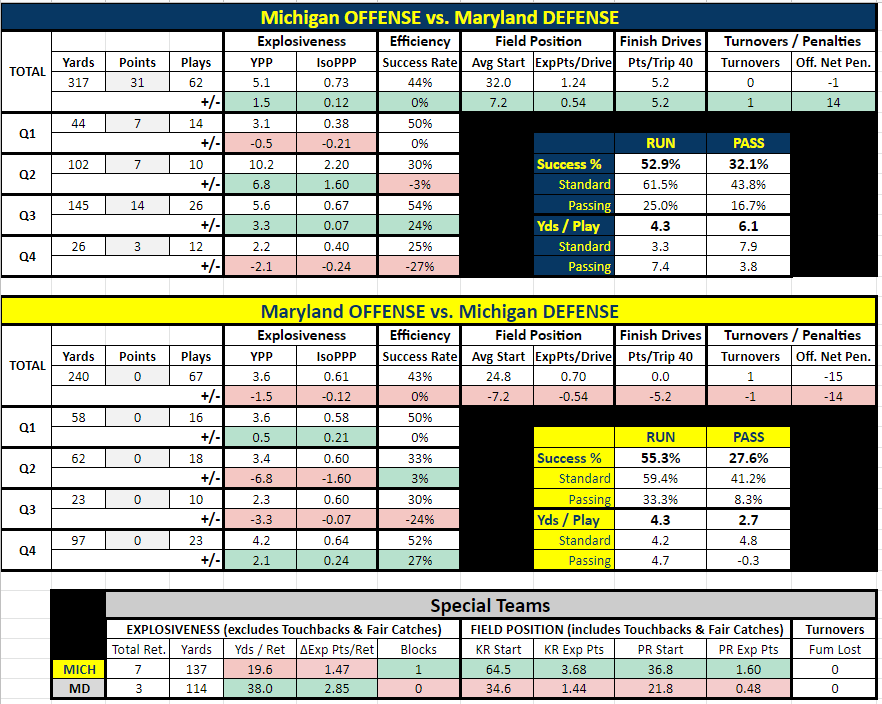
Jim Harbaugh’s offensive philosophy is a popular topic both locally and nationally. Conversations and debates range from Pro-style vs. Spread, to Power vs. Inside Zone, and even Clock Control vs. Quick Strike. I am going to focus on one of Michigan’s main objectives: to use balanced play calling to provide max flexibility by situation. To this point in the season, the Wolverines are averaging 59.3% run plays, and 40.7% pass plays. Total yardage is split even closer at 51.2% run and 48.8% pass. The play calling in the Maryland game followed this trend very closely, dividing 60.9% run and 39.1% pass.
We can also see balance when looking at Success Rate. Through six games, Michigan’s overall offensive success rate is 49.2%. This breaks down to a 50.4% Success Rate on run plays, and 47.5% Success Rate on pass plays. The Maryland game provides reason for optimism by showing the offense is on an upward trend. On Saturday, the Wolverines were successful on 57.1% of their run plays, and on 55.6% of their pass plays.
DEFENSE
From game to game, the Michigan defense is amazingly consistent from a Success Rate perspective. The Wolverines are allowing successful plays only 33.2% of the time. The most successful team was Northwestern, with a 39.7% success rate, while the least successful team was Nebraska at 24.0%. Perhaps the statistic that is most emblematic of Don Brown’s philosophy is the yardage allowed on unsuccessful plays: 56 yards. That is TOTAL, through SIX games. Two-thirds of the plays run against Michigan’s defense have accumulated just 56 yards, or 0.2 yards per play. For even more perspective, Maryland’s average of 0.9 yds per play on unsuccessful plays is the BEST by any team versus Michigan so far in 2018.
Overall, the Success Rate versus Michigan’s defense is also very consistent by quarter and by half. However, the two most troublesome performances stand out pretty clearly in their 1st Half / 2nd Half splits. Notre Dame: 1st Half – 42.5% / 2nd Half – 22.2% & Northwestern: 1st Half – 44.4% / 2nd Half – 33.3%. In the three key games coming up for the Wolverines, it feels like the halftime score will be particularly predictive. The key for the Michigan defense will be to eliminate the fast starts for their opponents.
S&P+ THROUGH WEEK 6
MICHIGAN S&P+
Overall: 22.7, 5th (up 2)
Offense: 36.3, 25th (up 2)
Defense: 14.0, 2nd (up 2)

REGULAR SEASON PROJECTIONS vs. RESULTS
vs. Maryland UM 42 MD 21
Pregame S&P+: UM by 9.15, 6-0
Pregame Clint: UM by 25, 5-1
MICH Cumulative 2ndO Wins: 5.4
@ Northwestern: UM 20 NEB 17
Pregame S&P+: UM by 10.7, 5-0
Pregame Clint: UM by 17, 4-1
MICH Cumulative 2ndO Wins: 4.4
vs. Nebraska: UM 56 NEB 10
Pregame S&P+: UM by 8.6, 4-0
Pregame Clint: UM by 11, 3-1
MICH Cumulative 2ndO Wins: 3.6
vs. SMU: UM 45 SMU 20
Pregame S&P+: UM by 20.0, 3-0
Pregame Clint: UM by 39, 2-1
MICH Cumulative 2ndO Wins: 2.6
vs. Western Michigan: UM 49 WMU 3
Pregame S&P+: UM by 10.8, 2-0
Pregame Clint: UM by 25, 1-1
MICH Cumulative 2ndO Wins: 1.6
@ Notre Dame: ND 24 UM 17
Preseason S&P+: ND by 0.1, 1-0
Preseason Clint: UM by 4, 0-1
MICH Cumulative 2ndO Wins: 0.6
NEXT UP
vs. Wisconsin: Overall 15.3, 13th
M Offense 36.3, (25th) vs. O Defense 27.8 (55th), Midpoint: 32.05
M Defense 14.0 (2nd) vs. O Offense 42.8 (8th), Midpoint: 28.4
PREGAME EDGE: Michigan
The midpoint S&P+ gives a 3.65 point edge to Michigan. The Badger offense is producing right around the rate at which most predicted in the preseason. However, it is a big surprise to see Wisconsin’s defense just barely above average. They were 9th in the preseason S&P+ rankings.
GAME WEEK UPDATE: Michigan would love to buck the trend of slow starts on both sides of the ball. The last thing the Wolverines want to do is spot the Badgers a lead for Jonathan Taylor and their O-Line to protect. I expect this to be very close into the 4th quarter, with a handful of defensive and special teams big plays delivering a huge win for Michigan.
Michigan 24 Wisconsin 20 (PRESEASON: Wisconsin 24 Michigan 21)
TL; DR SUMMARY
Balance on offense, and an attacking defense have led to a 5-1 start for the Wolverines. However, Michigan started 5-1 in 2017 also. Finding success into the November schedule (i.e. wins over Wisconsin, MSU, & PSU) is absolutely required to eliminate Michigan’s reputation for fading down the stretch under Jim Harbaugh.